Real Time PCR - Some Basic Principles
Overview
Real time PCR is a laboratory technique that can perform relatively accurate, reliable and reproducible measurements, to quantitatively determine the presence of specific gene sequences. Its value is being recognized in a variety of applications, including transgenic (GMO) detection. It is becoming increasingly important to know what percentage of a particular transgene is present in an export shipment, for example. Real time PCR can also be used to support more traditional plant breeding techniques, making the process of distinguishing allelic variations more efficient. This lesson explains the principles of real time PCR and its' application, with examples in plant breeding and GMO detection.
Real Time PCR - Some Basic Principles Introduction
Deana M. Namuth
Department of Agronomy and Horticulture
University of Nebraska-Lincoln, USA
(http://agronomy.unl.edu/fac/namuth.htm)
G. Ronald Jenkins
United States Department of Agriculture
Grain Inspection, Packers and Stockyards Administration
(http://www.usda.gov/gipsa/)
2004
 Lesson Navigation Tips: Lesson Navigation Tips:
- Click on ’Animations’ button found to the left in order to view the animation which supplements this lesson. You can also click on the animation icon within the text.
- Click once on figures to see enlarged versions.
- Click once on words in color to bring up their definitions.
|
Overview
Real time PCR is a laboratory technique that can perform relatively accurate, reliable and reproducible measurements to quantitatively determine the presence of specific gene sequences. Its value is being recognized in a variety of plant science applications, including transgenic (GMO) detection. It is becoming increasingly important to know what percentage of a particular transgene is present in an export shipment, for example. Real time PCR can also be used to support more traditional plant breeding techniques, making the process of distinguishing allelic variations more efficient. This lesson explains the principles of real time PCR and its application in plant breeding and GMO detection.
Objectives
This lesson assumes you are familiar with conventional PCR methods and builds upon those principles. If, however, you need some background information on conventional PCR, please refer to the Polymerase Chain Reaction lesson.
At the completion of this lesson, learners will be able to:
1. Describe how a GMO can be differentiated from a non-GMO.
2. Define real time PCR and contrast it with the conventional PCR method.
3. Identify and contrast different probe detection systems.
4. Explain in detail, the Taqman system.
5. Analyze the overall strengths and weaknesses of real time PCR.
Development of this lesson was supported in part by USDA Initiative for Future Agriculture and Food Systems (IFAFS)
and the Cooperative State Research, Education, & Extension Service,
U.S. Dept of Agriculture under Agreement Number 00-52100-9710.
Any opinions, findings, conclusions or recommendations expressed in this publication are those of the author(s) and do not necessarily reflect the view of the U.S. Department of Agriculture. A contribution of the University of Nebraska College of Agricultural Sciences and Natural Resources, Lincoln Nebraska 68583, Journal Series No. 04-13Need for Detecting GMOs?
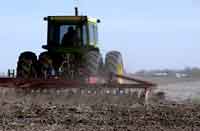 |
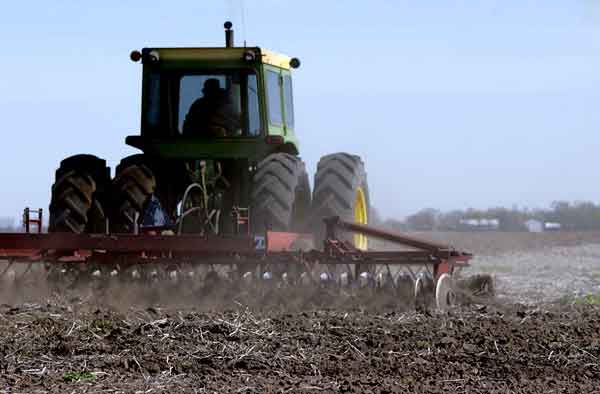
| Figure 1. A producer using mechanical tillage to prepare the soil for planting. |
Patricia, a producer in Eastern Nebraska, grows predominantly corn and soybeans, two important crops for that state. She encounters significant challenges each growing season. One major challenge is controlling European corn borer that, in some years, causes significant yield loss in her corn crop. Another challenge is weed control, which can require many hours of her time to till the fields with a tractor and implement (Figure 1). Alternatively, she can use a different tillage system which utilizes herbicides, but these chemicals can harm her crops or not effectively control weeds. She is also looking for other viable markets for her crops, so a more nutritious soybean variety might open new opportunities for her. Like any successful business person, Patricia continually looks for ways to address the challenges in her enterprise.
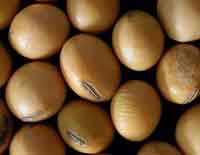 |
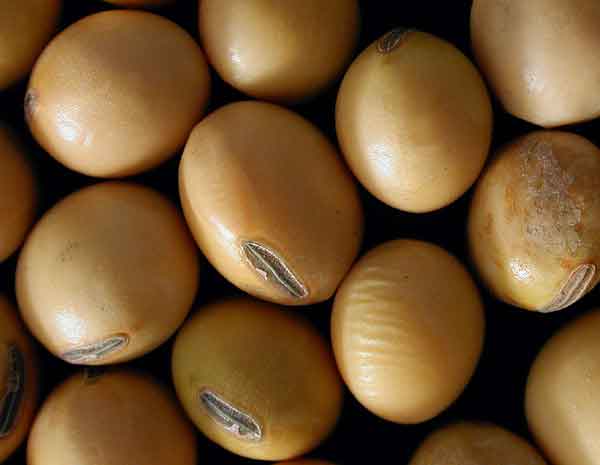
| Figure 2. A sample of soybean seeds. |
Advances in biotechnology have provided tools to growers such as Patricia that address these types of challenges. Through biotechnology, novel DNA sequences, from unrelated species, can be inserted into the chromosomes of plants, enabling them to express new traits. Bt corn for example, expresses a trait that was derived from the bacterium, Bacillus thuringensis. This Bt variety of corn does not require the application of pesticides, but is inherently lethal to the European corn borer (for more information see European Corn Borer and Bacillus thuringiensis). Roundup Ready corn and Roundup Ready soybeans (Figure 2) allow producers to spray glyphosate herbicides to control weeds, while leaving the crop unharmed (see Inhibitors of Aromatic Amino Acid Biosynthesis). This provides excellent weed control, leading to higher yields. At the same time, it minimizes tillage required, which can reduce soil erosion and fuel costs. Research developments are currently underway to produce crops with enhanced nutritional characteristics such as high oleic soybean, a more nutritious and healthy soybean for consumers (Buhr et al., 2002).
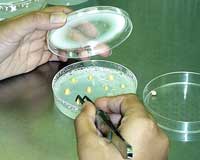 |
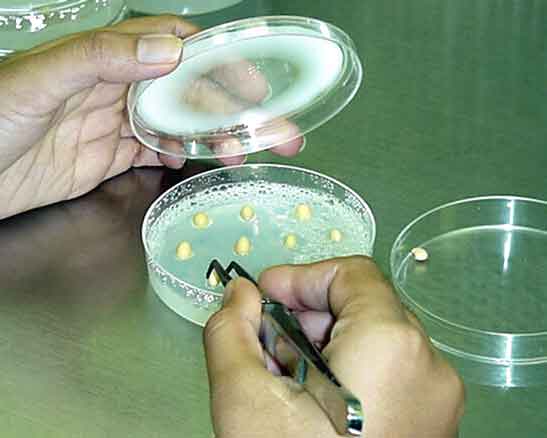
| Figure 3. A laboratory technique in biotechnology called ’tissue culture.’ |
As these examples suggest, transgenic technology has introduced traits into food and fiber crops that are attractive to producers and the technology has the potential to provide many traits that meet the needs of specific consumers. As a result, there is a growing need for the development of technologies that detect transgenes and identify transgenic crops in the food, feed and fiber markets. For example scientists who insert transgenes into crop varieties using biotechnology processes utilize laboratory procedures to monitor their success (Figure 3). Plant breeders who cross these novel genes into plant germplasm can benefit from efficient methods to distinguish plants that are homozygous (two copies) as hemizygous (one copy) for the transgene. Similarly, detection techniques are needed for researchers interested in understanding potential impacts of the escape of these transgenes (gene flow) to non-adapted germplasm pools. Finally, sometimes consumers, regulators and food processors are interested in knowing whether the foods they are purchasing contain genes inserted by means of biotechnology. For example, the European Union states they will only import grain and oil seed shipments which contain 0.9% or less of an approved GMO, and 0% for unapproved events. (See AgBios).
GMO Detection
Now that it is more apparent why we need to detect the presence of a genetically engineered crop and even in some cases the number of copies of a transgene in a sample, let’s explore how we can make these measurements. If your background knowledge about the genetic engineering process in plants is uncertain, before going further you might want to refer to two other lessons: Just the Facts and Overview of Plant Engineering.
In all instances, GMO and non-GMO varieties differ in their genetic make-up, but might contain only subtle differences at the protein level. For example, consider a variety of Roundup Ready Corn in which the GA21 event provides protection from glyphosate herbicides. In this case there are only 2 amino acid sequence differences between the native, susceptible EPSPS protein expressed in all corn plants, compared with the resistant version of corn EPSPS protein expressed in GMO plants. A protein assay that would discern between these two isoforms of the EPSPS protein would be very difficult, if not impossible, leaving DNA testing as the only option. For all other GMO plants currently available on the market, the novel protein(s) expressed do have significantly different conformational structures and can be distinguished from the native protein(s). Another example where DNA detection is the best alternative is when transgenes turn off native genes and thus prevent protein synthesis (see Antisense RNA Technology Animation below). Two formats for protein-based testing are currently available: Lateral Flow Strip (LFS) tests and Enzyme-Linked Immunosorbent Assay (ELISA) test. These tests can be sensitive, rapid and easy to use. However, due to variable protein expression levels, protein-based testing has a limited capability for producing quantitative results.
 |
| Antisense RNA Technology Animation |
The laboratory procedure known as PCR (see lesson Polymerase Chain Reaction ), is a DNA based method that detects a target DNA sequence unique to the transgenic variety. The term 'target DNA' refers to the particular portion of the DNA sequences which are going to be copied during PCR. DNA-based testing is designed to detect unique nucleotide sequences associated with a particular event and generally falls into two categories: Conventional Polymerase Chain Reaction (PCR) and Real Time Polymerase Chain Reaction (RT-PCR) technologies. Conventional PCR can be event specific, but has limited capability for producing quantitative results. Conversely, RT-PCR, also event specific, has the practical capability to produce quantitative results.
This lesson focuses on the RT-PCR process for detection of DNA sequences in GMO varieties. Measuring proteins or measuring target DNA sequences each have their own advantages and disadvantages. First, a few thoughts. When detecting proteins, it is important to know what promoter and coding region were used in the transgenic event. This will dictate which antibodies and what tissue you sample for obtaining a reliable result. Another situation is in processed products such as taco shells, where heating may destroy protein structure and thus eliminate detection. With DNA-based testing it is important to know some information on the event’s DNA sequence, but the gene will be present in all tissues at all life cycle stages of the plant. However, DNA can be degraded in food processing.
Presence/Absence Not Enough
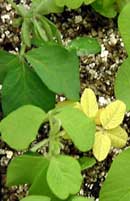 |
| Figure 4.Three leaf color phenotypes in soybean seedlings: yellow, light green and dark green. |
With GMO detection, scientists and consumers are interested in only one of the thousands of genes a plant contains. Some genes control phenotypes that are easy to measure such as leaf color (Figure 4). However, sometimes a gene may encode for a particular protein that controls a more difficult to measure trait, such as resistance to an insect (Bt corn and cotton). The challenge is that a single gene copy is not easily detectable using some molecular biology technologies. However, with the PCR process, copies of the target DNA sequence are replicated, enabling the investigator to identify the presence of a particular gene.
The concept is similar to being in an airplane at night, looking down on a friend, holding a flashlight. You will not be able to see the light emitted by the single flashlight because it is too dim. This is analogous to one copy of the Bt gene amongst the thousands of genes found in a corn seed. However, if your friend recruited an entire city of people to also hold flashlights, then you could see the emitted light. PCR is a laboratory process which generates copies of a particular segment of DNA already present, so that it can be detected. The PCR process can enable us to determine whether our sample (i.e. plant, seed or food product) contains a transgene or not.
Unfortunately, merely detecting the presence or absence of a particular gene in grains or food products does not always satisfy researchers, government regulators, processors or consumers. As an example, they may need to know what percent of transgenic seed is present in the entire sample. Is there any contamination of an unapproved event in a shipment? Back to the flashlight analogy, you would want to determine how many of your friends initially held flashlights before they had recruited more people to hold flashlights. This is how quantitative or real time PCR works. Based upon results obtained during the PCR process, the initial amount of a particular gene present in an unknown sample can be measured. In plant breeding applications, researchers will be able to tell if a plant is homozygous for the transgene or hemizygous. Alternatively, some of the transformation methodologies often result in multiple copies of a transgene inserting into plant chromosomes. Real time PCR would be able to measure these copy numbers.
Defining Real Time PCR
By definition, a PCR reaction is being monitored in “real time,' when DNA detection and amplification (copying) are being measured simultaneously throughout the reaction process. Real time PCR utilizes laser optics and fluorescing molecules ( probes ) to measure amplification at each cycle of the PCR process rather than at the completion of the final cycle. Back to the flashlight analogy, with conventional PCR you would observe light only after all of the participants in the city turned on their flashlights. In contrast with real time PCR, you would be looking for light when a handful of friends initially turned on their flashlights, and then again each time they added more people to their group, until all of the participants in the city turned on their flashlights.
RT PCR Terminology
 |
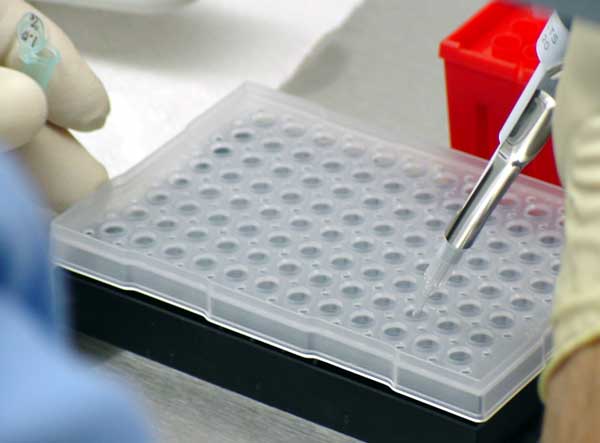
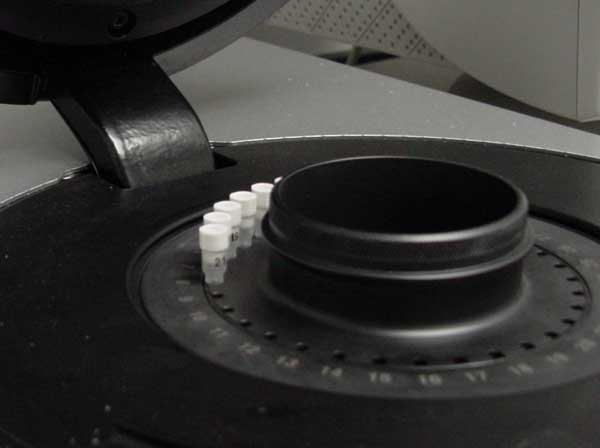
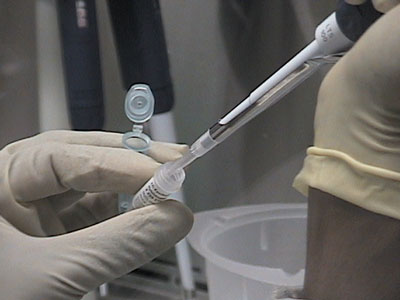
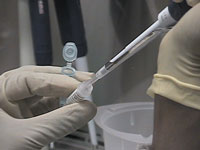
| Figure 5. Setting up a real time PCR reaction. |
You might come across two different terms in your molecular biology studies, “quantitative PCR ” and “real time PCR.” These refer to the same type of PCR process and are used interchangeably. However, real time PCR is sometimes abbreviated RT-PCR, which unfortunately is the same abbreviation used for a different laboratory technique, called reverse transcription PCR. Reverse transcription PCR uses the enzyme, reverse transcriptase and an RNA template to create DNA molecules. In contrast, as you will discover in the next sections, real time PCR uses the enzyme, Taq polymerase, and a DNA template for creating DNA molecules (Figure 5).Temperature Cycles in Real Time PCR
 |
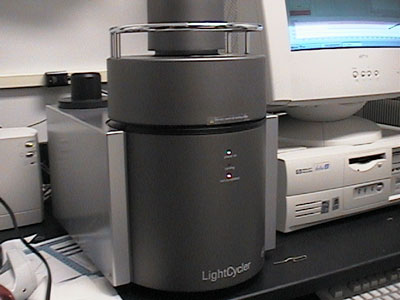
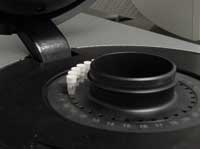
| Figure 6. A light cycler PCR machine used in a laboratory. |
Now that we have a working definition of real time PCR, we will learn how this technique actually works. The procedure of real time PCR is very similar to conventional PCR (see Polymerase Chain Reaction ). Both real time and conventional PCR require heating and cooling cycles throughout the reaction. The heating cycles denature the DNA templates and the cooling cycles allow for primers to anneal to their target. In some cases of real time PCR, a specially labeled probe also binds during the cooling cycle. The key difference in the two types of PCR systems lies in how the amplified DNA sequences are detected. Figure six shows an example of equipment used in real time PCR experiments.Real Time PCR Components
 |
| Figure 7. Diagram of components needed in real time PCR. |
As in conventional PCR, real time PCR requires the addition of nucleotides (A, C, G, T), reaction buffer, sequence-specific primers (two oligonucleotides, each generally 18 to 20 nucleotides in length), Taq polymerase, magnesium and water. Real time PCR requires one additional component, either a fluorescent dye that binds double stranded DNA or a fluorescent labeled probe (Figure 7). A labeled probe is an oligonucleotide that is 25 to 30 nucleotides in length, chemically modified to contain a fluorophore. The fluorophore emits energy at a specified wavelength when excited by a light source, and is detectable by the PCR instrument. Referring back to our flashlight analogy earlier, a fluorophore would be the flashlights which enable us to “see” people from our airplane.
The concept of a “probe” can be difficult for learners to grasp, but it is critical in many molecular biology applications. In some applications of using “probes,” scientists are searching for a small gene that represents only a tiny fraction of all the DNA in a plant’s nuclear genome. In other cases, a “probe” can be used to search out a single RNA sequence or protein produced by a plant or other organism. It is a bit like the saying, “looking for a needle in a haystack”. A probe, then, is a specific sequence, either DNA, RNA or protein, depending upon the experiment, which will react only with the gene/RNA/protein of interest at the exclusion of all others. This probe has been labeled in such a way for it to be detectable by the researcher, such as with a radioactive chemical, a fluorophore, an antibody, etc. It is also designed to be highly specific, such that it reacts with (binds with), only the sequence of interest. A probe is analogous to the flashlights being attached to people, not also to trees, cars, buildings, dogs, etc.Probe Systems - SYBR Green
Several different chemistries are commonly used for real-time PCR detection. All of the systems have one principle in common; they all measure fluorescence during the PCR process. For all chemistries, the amount of emitted fluorescence is proportional to the amount of product (copies of the specific gene) being made in the PCR reaction.
The simplest principle of detecting fluorescence is based upon intercalation dyes that bind double-stranded DNA made during PCR. The other principles are based upon chemically modified oligonucleotides, or fluorescent labeled probes that are added during the setup of the reaction. Fluorescence is released and detected either after degradation of the probe (hydrolysis probes) or hybridization of two oligonucleotides to the target (hybridization probes). Adding the probe, along with the oligonucleotide primers increases the specificity of the quantified PCR product over the intercalation systems. Other detection technologies have also been developed. These include Scorpions (Whitcome et al., 1999; Thewell et al., 2000) and Molecular Beacons (Tyagi and Kramer 1996; Tyagi et al., 2000) but will not be discussed in this lesson. First we will discuss the intercalation system.
SYBR Green - Intercalation dye (Holden et al., 2003, Terry et al., 2002)
SYBR green is an intercalating dye and functions similar to ethidium bromide (Figure 8). SYBR green binds more efficiently to double stranded DNA, than it does to single stranded DNA. Remember that after the heating cycles of PCR, the DNA molecules have been denatured and are single stranded. However, after the extension stage of PCR when the complementary copies of the templates have formed, a maximum amount of dye will bind into the minor groove of the now double stranded DNA. Thus, a fluorescence signal is detected and increases as more copies of the target gene are made at the completion of each cycle in the PCR process. Unfortunately, SYBR green will also bind to other double stranded, non-specific PCR products such as primer-dimers . To provide better sequence-specificity and detection, both FRET and Taqman technologies have been developed. These methods are discussed next.Probe Systems - FRET
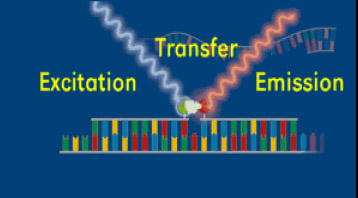
FRET -- Hybridization Probe Example (Haugland et al., 2002)
FRET is an acronym for Fluorescence Resonance Energy Transfer. In this type of detection system, two flanking primers are needed; in addition, two oligonucleotide probes are also required (as compared to only one in the Taqman format). The probes must be located internal of the flanking primers. On the 3’ end of one chemically modified oligonucleotide is a fluorescein donor molecule. This molecule becomes excited when an LED light source from the PCR machine emits light at 493 nm. Adjacent to the donor, on the 5’ end of the other chemically modified oligonucleotide is an acceptor molecule (Figure 9), which emits fluorescence at either 640 nm or 710 nm. The acceptor must be located near (1-5 nucleotides) the donor for light energy to be transfered from the donor to the acceptor. When they are far from one another, the donor emits light at 493 nm (Figure 10).
 |
| Figure 12. PCR machine where temperature cycles are performed and fluorescence measured. |
However when the two probes are close, light is absorbed by the donor molecule and transferred to the acceptor, then the acceptor molecule will emit fluorescence at 640 - 710 nm (Figure 11). This fluorescence is measured by the PCR machine using optics and photohybrids (Figure 12). Using the FRET technology, fluorescence measurements are taken at the end of the annealing stage. This is different from the Taqman system in which measurements are made at the end of the extension stage of PCR.
Click below to view a video clip where Dr. Luke Shokere demonstrates how to run a PCR experiment using the FRET probe system. If you have slow 'dial-up' Internet service, choose the smaller video file to view. (NOTE: These videos are in Windows Media Video [.wmv] format, and require a video player to view. Download a free viewer at the following address: http://www.microsoft.com/windows/windowsmedia/9series/player.aspx)
 |
|
| FRET video for slower Internet connections. |
FRET video clip with greater resolution for high speed Internet connections. |
Probe Systems - Taqman
Taqman - Hydrolysis Probe Example (Heid et al., 1996)
This animation depicts the details of how the Taqman probe system works. You may wish to view it now or come back after reading the next section.
 |
| Figure 13. Illustration of the Taqman probe design. |
The Taqman system utilizes a labeled probe that contains a reporter molecule (FAM) attached at the 5’ end of the oligonucleotide (yellow ball in Figure 13). This molecule gives off fluorescence when excited at a specific wavelength of light from the Taqman machine. Adjacent to the reporter molecule, at the 3’ end of the oligonucleotide probe is a quencher molecule (TAMARA)(cloud in Figure 13). When the quencher is located near the reporter, it prevents the reporter from fluorescing. This is the state of the probe in the beginning of the PCR experiment, no fluorescence is detected.
When the PCR reaction is in the cooling stage of a cycle, the probe binds to the DNA template along with the primers in the typical complementary nature of cytosine (C) pairing with guanine (G), and adenine (A) pairing with thymine (T) (Figure 14). The DNA polymerase enzyme, Taq polymerase, binds first to the 3’ end of the primers and then systematically begins adding new complementary DNA nucleotides in a 5’ -> 3’ direction to the growing copy of the target gene (Figure 15). Taq polymerase also has an exonuclease activity as a normal function, which allows it to remove DNA nucleotides if mistakes are made during the DNA replication process. In real time PCR experiments, when Taq polymerase reaches the bound probe, this exonuclease function enables it to remove the probe nucleotide by nucleotide as it is also adding new nucleotides to the new DNA strand. As a result, this breaks apart the reporter on the 5’ end from the quencher molecule on the 3’ end, and fluorescence is given off (Figure 16). The more copies of the target DNA present, the more probe which can bind and therefore, the more fluorescence detected.
 |
 |
 |
| Figure 14. Binding of probes and primers in the annealing stage. |
Figure 15. The extension stage of PCR. |
Figure 16. The quencher and reporter are no longer located near each other and fluorescence is emitted. |
Click below to view a video clip where Dr. Louis Busjaeger demonstrates how to run a PCR experiment using the Taqman probe system. If you have slow 'dial-up' Internet service, choose the smaller video file to view. (NOTE: These videos are in Windows Media Video [.wmv] format, and require a video player to view. Download a free viewer at the following address:
http://www.microsoft.com/windows/windowsmedia/9series/player.aspx)
| |
|
| Taqman video for slower Internet connections. |
Taqman video clip with greater resolution for high speed Internet connections. |
Using Data from Real Time PCR
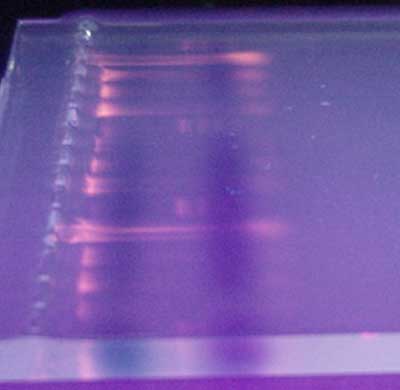
With conventional PCR a sample of the final reactions is taken from each tube and run through a gel electrophoresis to separate DNA bands (Electrophoresis: How scientists observe fragments of DNA). The gel is stained and these bands, containing the amplified (copied) DNA, are visible under ultra-violet light (Figure 17).
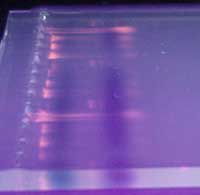 |
| Figure 17. DNA visualized in a gel placed onto an ultra-violet light source. |
However, this visualization is not quantitative, instead merely detects the presence of a certain DNA sequence. The number of DNA copies making the bands is not calculated nor is the amount of a specific gene present in the starting sample measurable. In real time PCR though, measurements are detected at each cycle and the data collected by a computer. The resulting graph of fluorescence measurements at each cycle is used to define the exponential phase of the reaction, a prerequisite for accurate determination of copy number at the beginning of the reaction.
The image shown in Figure 18 graphically illustrates the differences in observing the results of conventional and real time PCR. The arrows show where fluorescence in a Taqman system is first detected at a significant level for each sample being tested for a Bt event. We can easily determine that each sample contains a different concentration level of Bt genes at this point of the real time PCR experiment.
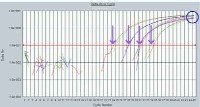 |
| Figure 18. Graph showing detection differences between Real Time and Conventional PCR measurements |
The first arrow on the left shows the sample which had a significant fluorescence detected earliest. Therefore it has more copies of the Bt event present initially. If we were using conventional PCR, our detection measurement would not take place until the end of the experiment, as indicated by the circle in this figure. Due to the exponential amplification nature of PCR, by the end of the experiment, it is impossible to discern differences in Bt gene concentrations among the samples.
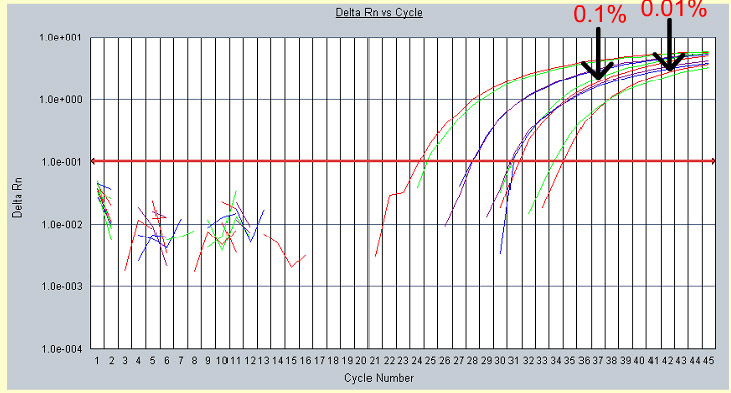
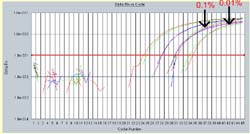
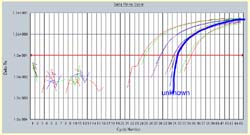
The image shown in Figure 19 is obtained from a real time PCR experiment. The cycle numbers are along the x-axis and amount of fluorescence along the y-axis. In this experiment GMO-DNA standards at 10%, 1%, 0.1% and 0.01 % GMO DNA, along with an unknown sample were tested. At approximately cycle #24 the fluorescence peak for the 10% GMO standard crosses the CT threshold (red line) and goes into the exponential phase. Signals detected below the CT are merely background noise. The least concentrated GMO-DNA standard crosses the CT threshold at Cycle 31. Therefore, the more copies of a gene present initially, the quicker the amount of fluorescence emitted will reach the CT threshold.
 |
 |
| Figure 19. Data from a real time PCR experiment with known varying concentrations of a gene standard. |
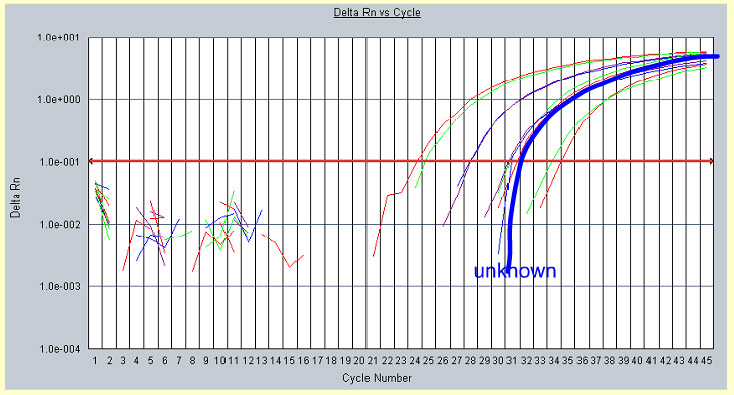
Figure 20. Plotting real time PCR data from a sample with unknown gene concentration onto the standards graph from the same experiment. |
In Figure 20 the unknown sample fluorescence data is applied and falls along the 0.1% GMO-standard graph. This indicates that the unknown sample contains the same amount of GMO-DNA as the 0.1% concentration standard.
Similarly, genotype differences can be measured. For example in a plant breeding program, if a Taqman probe is designed to bind to a 'R' gene allele but not to a 'r' allele, then a homozygous (RR) and heterozygous (Rr) plant can now be distinguished without having to go through progeny testing. Similarly, a homozygous (RR) and a hemizygous (R-) GMO can also be distinguished from one another.
In real time PCR, the results obtained are always related to a control. The copy number of the endogenous gene control should be well characterized and demonstrated in a variety of plant sources. The expected size of the amplified product for an endogenous control obtained must agree with the results expected in the researcher’s experiment in order for the entire experimental data to be considered valid. If results obtained from the endogenous control are not as expected, then results obtained for other target DNA sequences in the same experiment are considered invalid. This critical factor defines the reliability of obtained data in each real time PCR procedure.Strengths/weaknesses of Real Time PCR
Real time PCR has advantages over nonconventinal PCR because it provides a wide dynamic range for quantification, contains high sensitivity, and improved precision. Also, since the method is being performed in a real-time format, no post-PCR steps are required, such as agarose gel electrophoresis. Real time PCR has the ability to detect very small amounts of target DNA, but that also means small experimental errors are also detected and amplified, increasing the risk of unreliable results. The accuracy of data, using real time PCR, is largely dependent upon several factors within the sample itself, as well as those in the laboratory. Even the randomness of a sample selection (i.e. 1000 seed count from a truckload) will impact the results of accuracy (Jenkins, 2002). From the sample perspective, knowing the zygosity is important. For example corn leaf tissue is 2n, but endosperm is 3n. The parental breeding lines might be homozygous, but the variety a producer grows might be hemizygous. Then to make things even more complicated, the number of gene copies actually inserted during the plant transformation process (i.e. gene gun, Agrobacterium) will vary from one to many copies per plant genome. Reference materials where these characteristics are defined can be used as controls to standardize the tests.
 |
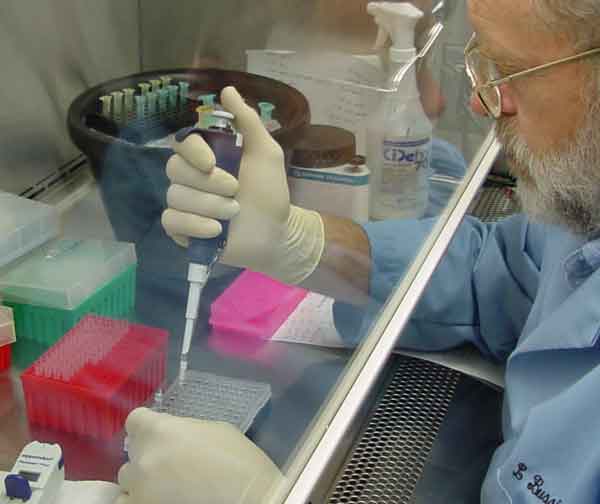
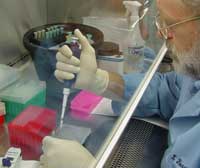
| Figure 21. USDA-GIPSA scientist pipetting PCR reagents. |
Several laboratory factors affect real time PCR data results as well. A few are described here. Researchers have found that chemicals naturally present in plant tissue, such as glucuronic acid and alginic acid can interfere with the success of real time PCR (Figure 21). Also, certain combinations of PCR reagents perform better than others (Holden et al., 2003). Even the type of commercially available Taq polymerase or an individual PCR machine being used can give varying effects. However, the use of endogenous gene controls aid in finely tuning data obtained in the real time PCR assay. Successful amplification of an endogenous gene is not a guarantee that the DNA is of sufficient purity for amplification and detection of a gene present in many fewer copies, such as would be expected in export shipments containing some small percentage of GMO’s (Holden et al., 2003).
As these variable examples indicate, strict and careful laboratory procedures must be followed in order to produce reliable and reproducible results. The USDA-GIPSA (United States Department of Agriculture - Grain Inspection, Packers and Stockyards Administration division) is an organization that has established a proficiency program for improving the reliability and credibility of PCR based testing for biotechnology-derived events and the development of reference materials (Figure 22).
 |
| Figure 22. USDA-GIPSA scientist testing materials in the proficiency program. |
The proficiency program has proven to be beneficial for organizations that test for the presence of biotechnology-derived events in grains and oil seeds, with many organizations from several countries enrolled in the program.
The National Institute of Standards and Technology (NIST) (http://www.cstl.nist.gov/div831/) and the USDA/GIPSA (http://www.usda.gov/gipsa/biotech/biotech.htm) have established confidentiality and/or material transfer agreements with life science organizations and industries that develop biotechnology-derived events in grains and oilseeds. With these agreements in place, NIST and USDA/GIPSA have created an ongoing collaborative research program to improve DNA-based testing methods and investigate the development of reference materials. This will make possible inter-laboratory calibration and validation of methods in real time PCR assays.Summary for Real Time PCR - Basic Principles
As we have seen in this lesson, there are several needs for gaining information on specific DNA sequences a crop plant may contain. Scientists, plant breeders, government regulators and consumers are in situations where it is important to know not only if a transgene is present, but also how many copies of such a gene may be present. Real time PCR has been widely used to quantitatively estimate such measurements. It can detect very small amounts of target DNA, with high sensitivity, relatively good accuracy and improved precision.
 |
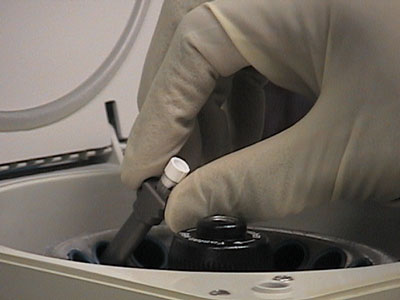
|
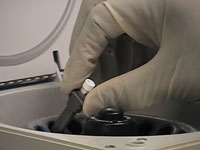
| Figure 23: A centrifugation step in the real time PCR process. |
Real time PCR can utilize several different probe chemistries, where fluorescence emission is detected as the PCR reactions take place rather than at the completion of all cycles. The SYBR Green probe system intercalates into double stranded DNA molecules, while Taqman and FRET utilize primers and labeled probes to be more sequence specific. The amount of fluorescence emitted is proportional to the amount of the particular DNA sequence being studied, such as a transgene. The accuracy of data, using real time PCR, is largely dependent upon several factors including sample preparation, quality performance of standard reference materials, and choice of an endogenous control gene. The USDA-GIPSA Proficiency Program is an example of collaborations formed to make steps towards standardizing the use of real time PCR in GMO detection.
References for Real Time PCR - Basic Principles
Buhr T, Sato S, Ebrahim E, Xing A, Zhou Y, Mathiesen M, Schweiger B, Kinney A, Staswick P, and Clemmente T (2002). Ribozyme termination of RNA transcripts down-regulate seed fatty acid genes in transgenic soybean. The Plant Journal 30(2):155-163.
Haugland, R.P. (2002). The handbook of Fluorescent Probes and Research Products, Ninth Edition. Molecular Probes, Inc. http://www.probes.com.
Heid CA, Stevens J, Livak KJ, and Williamson PM (1996). Real time quantitative PCR. Genome Research 6:986-994.
Holden MJ, Blasic JR, Bussjaeger L, Kao C, Shokere LA, Kendall DC, Freese L, and Jenkins GR (2003). Evaluation of extraction methodologies for corn kernel (Zea mays) DNA for detection of trace amounts of biotechnology-derived DNA. Journal of Agricultural and Food Chemistry (51)9:2468-2474.
Jenkins, G.R. (2002) Updated Methodologies for the Detection of Genetically Modified Events in Grains. XXIV Congresso Nacional De Milho E Sorga, Floranopolis, Brazil.
Terry CF, Shanahan DJ, Ballam LD, Harris N, Mcdowell DG, and Parkes HC (2002). Real-Time Detection of Genetically Modified Soya Using Lightcycler and ABI 7700 Platforms with Taqman, Scoripon, and SYBR Green I Chemistries. Journal of AOAC International 85(4):938-944.
Thewell N, Millington S, Solinas A, Booth J, and Brown T (2000). Mode of action and application of Scorpion primers to mutation detection. Nucleic Acids Research 28:3752-3761.
Tyagi S and Karmer FR (1996). Molecular Beacons: Probes that fluoresce upon hybridisation. Nature Biotechnology 14:303-308.
Tyagi S, Marras SAE, and Kramer FR (2000). Wavelength-shifting molecular beacons. Nature Biotechnology 18:1191-1196.
Whitcome D, Theaker J, Guy SP, Brown T, and Little S (1999). Detection of PCR products using self-probing amplicons and fluorescence. Nature Biotechnology 17:804-807.